Debugger Scripting: Automating the ABAP Debugger

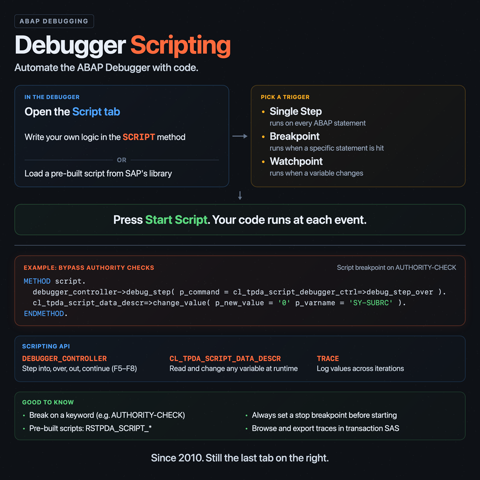
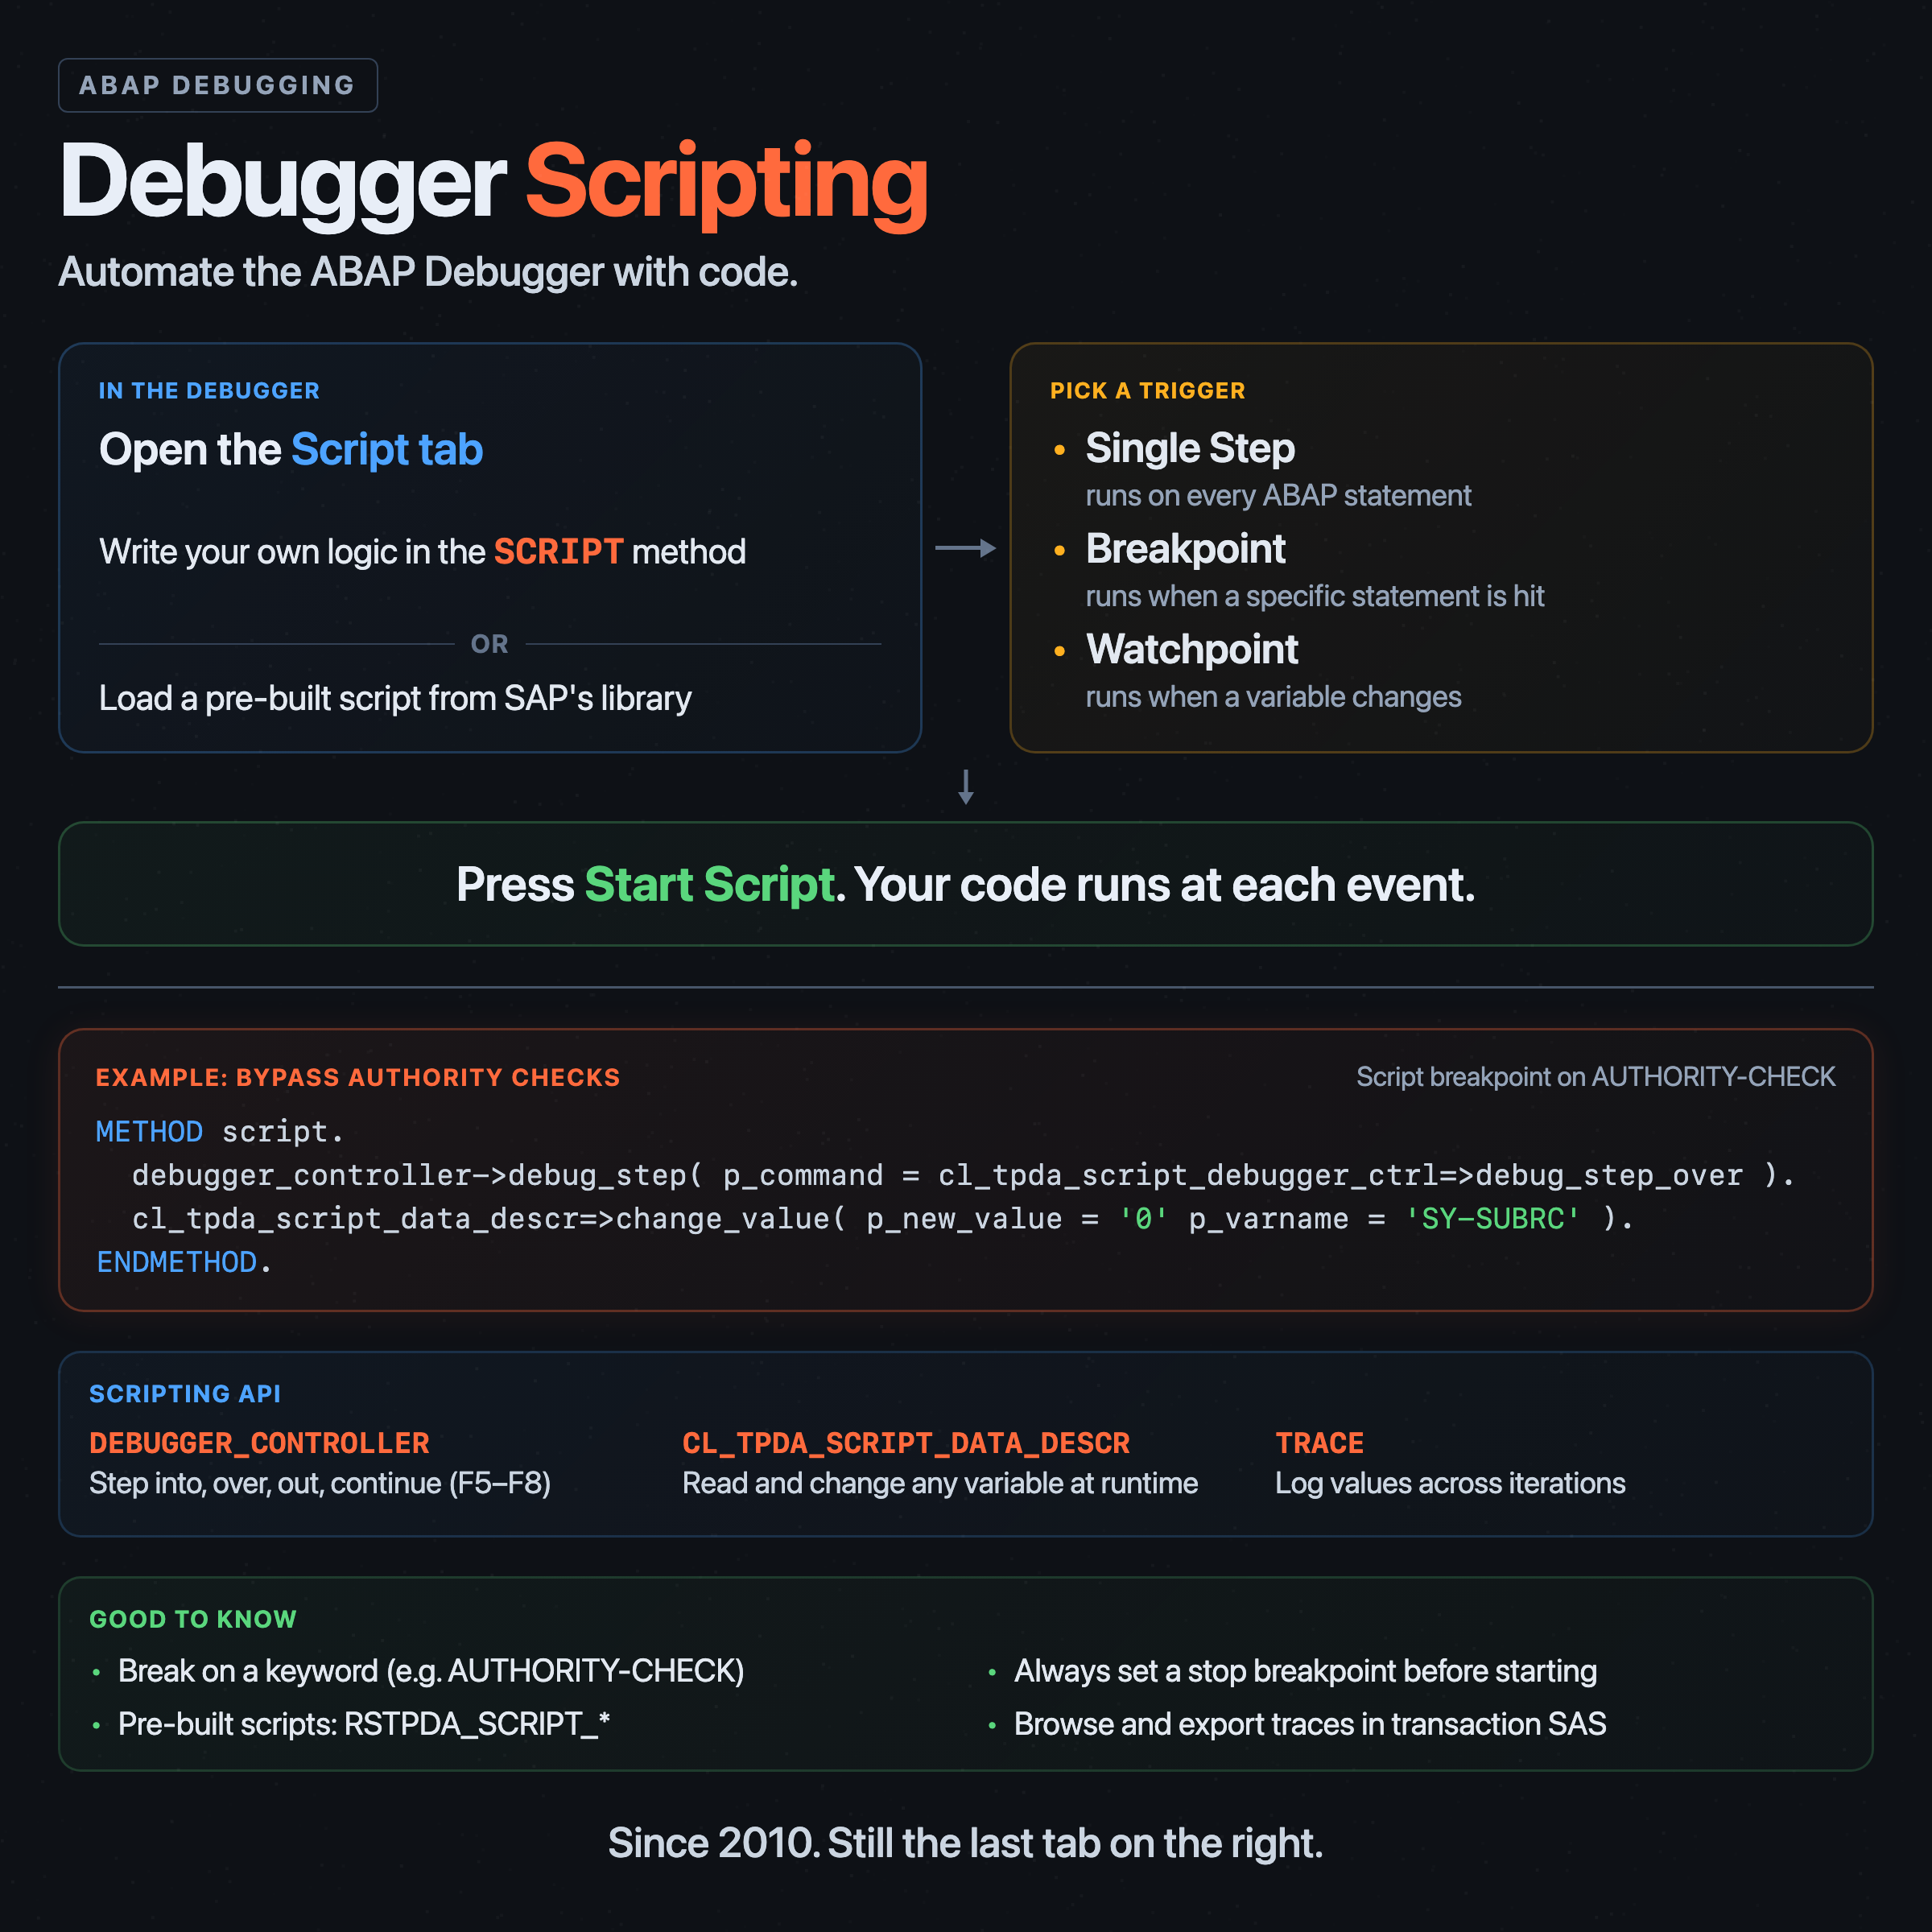
The ABAP debugger has a scripting interface. It has been there since NetWeaver 7.0 EHP2, which shipped around 2010. SAP called it a feature of the "New ABAP Debugger," which is a name that has aged about as well as you would expect after sixteen years. Scroll the debugger's tab strip all the way to the right and the very last tab is "Script." Most people never get that far.
Debugger scripting solves the kind of problem where you catch yourself doing the same manual steps over and over. Set a breakpoint, hit F8, inspect a variable, change a value, hit F8 again. Do that forty times and you start questioning your life choices. A script does the same thing without the existential crisis.
What a script looks like
A debugger script is a subroutine pool that defines a local class inheriting from CL_TPDA_SCRIPT_CLASS_SUPER. The class has four methods you can redefine:
PROLOGUEhandles technical initialization. The debugger infrastructure generates theABAP_SOURCEhandler here. You typically leave this one alone.INITruns once when the script starts. Set up your variables, configure breakpoints, prepare whatever state your script needs.SCRIPTis the main entry point. It runs each time the configured trigger fires. This is where your logic goes.ENDruns once when the script stops. Cleanup, final trace output, that kind of thing.
For most scripts, you only touch INIT and SCRIPT. The class definition looks like this:
CLASS lcl_debugger_script DEFINITION
  INHERITING FROM cl_tpda_script_class_super.

  PUBLIC SECTION.
    METHODS: prologue  REDEFINITION,
             init      REDEFINITION,
             script    REDEFINITION,
             end       REDEFINITION.

ENDCLASS.
The script interacts with the debugger through two instance attributes: DEBUGGER_CONTROLLER for controlling execution (step into, step over, continue) and TRACE for writing to the trace log.
Triggers: when the script actually runs
This part matters and is easy to get wrong. The Script tab has a "Trigger" panel on the left side that controls when the debugger executes your SCRIPT method.
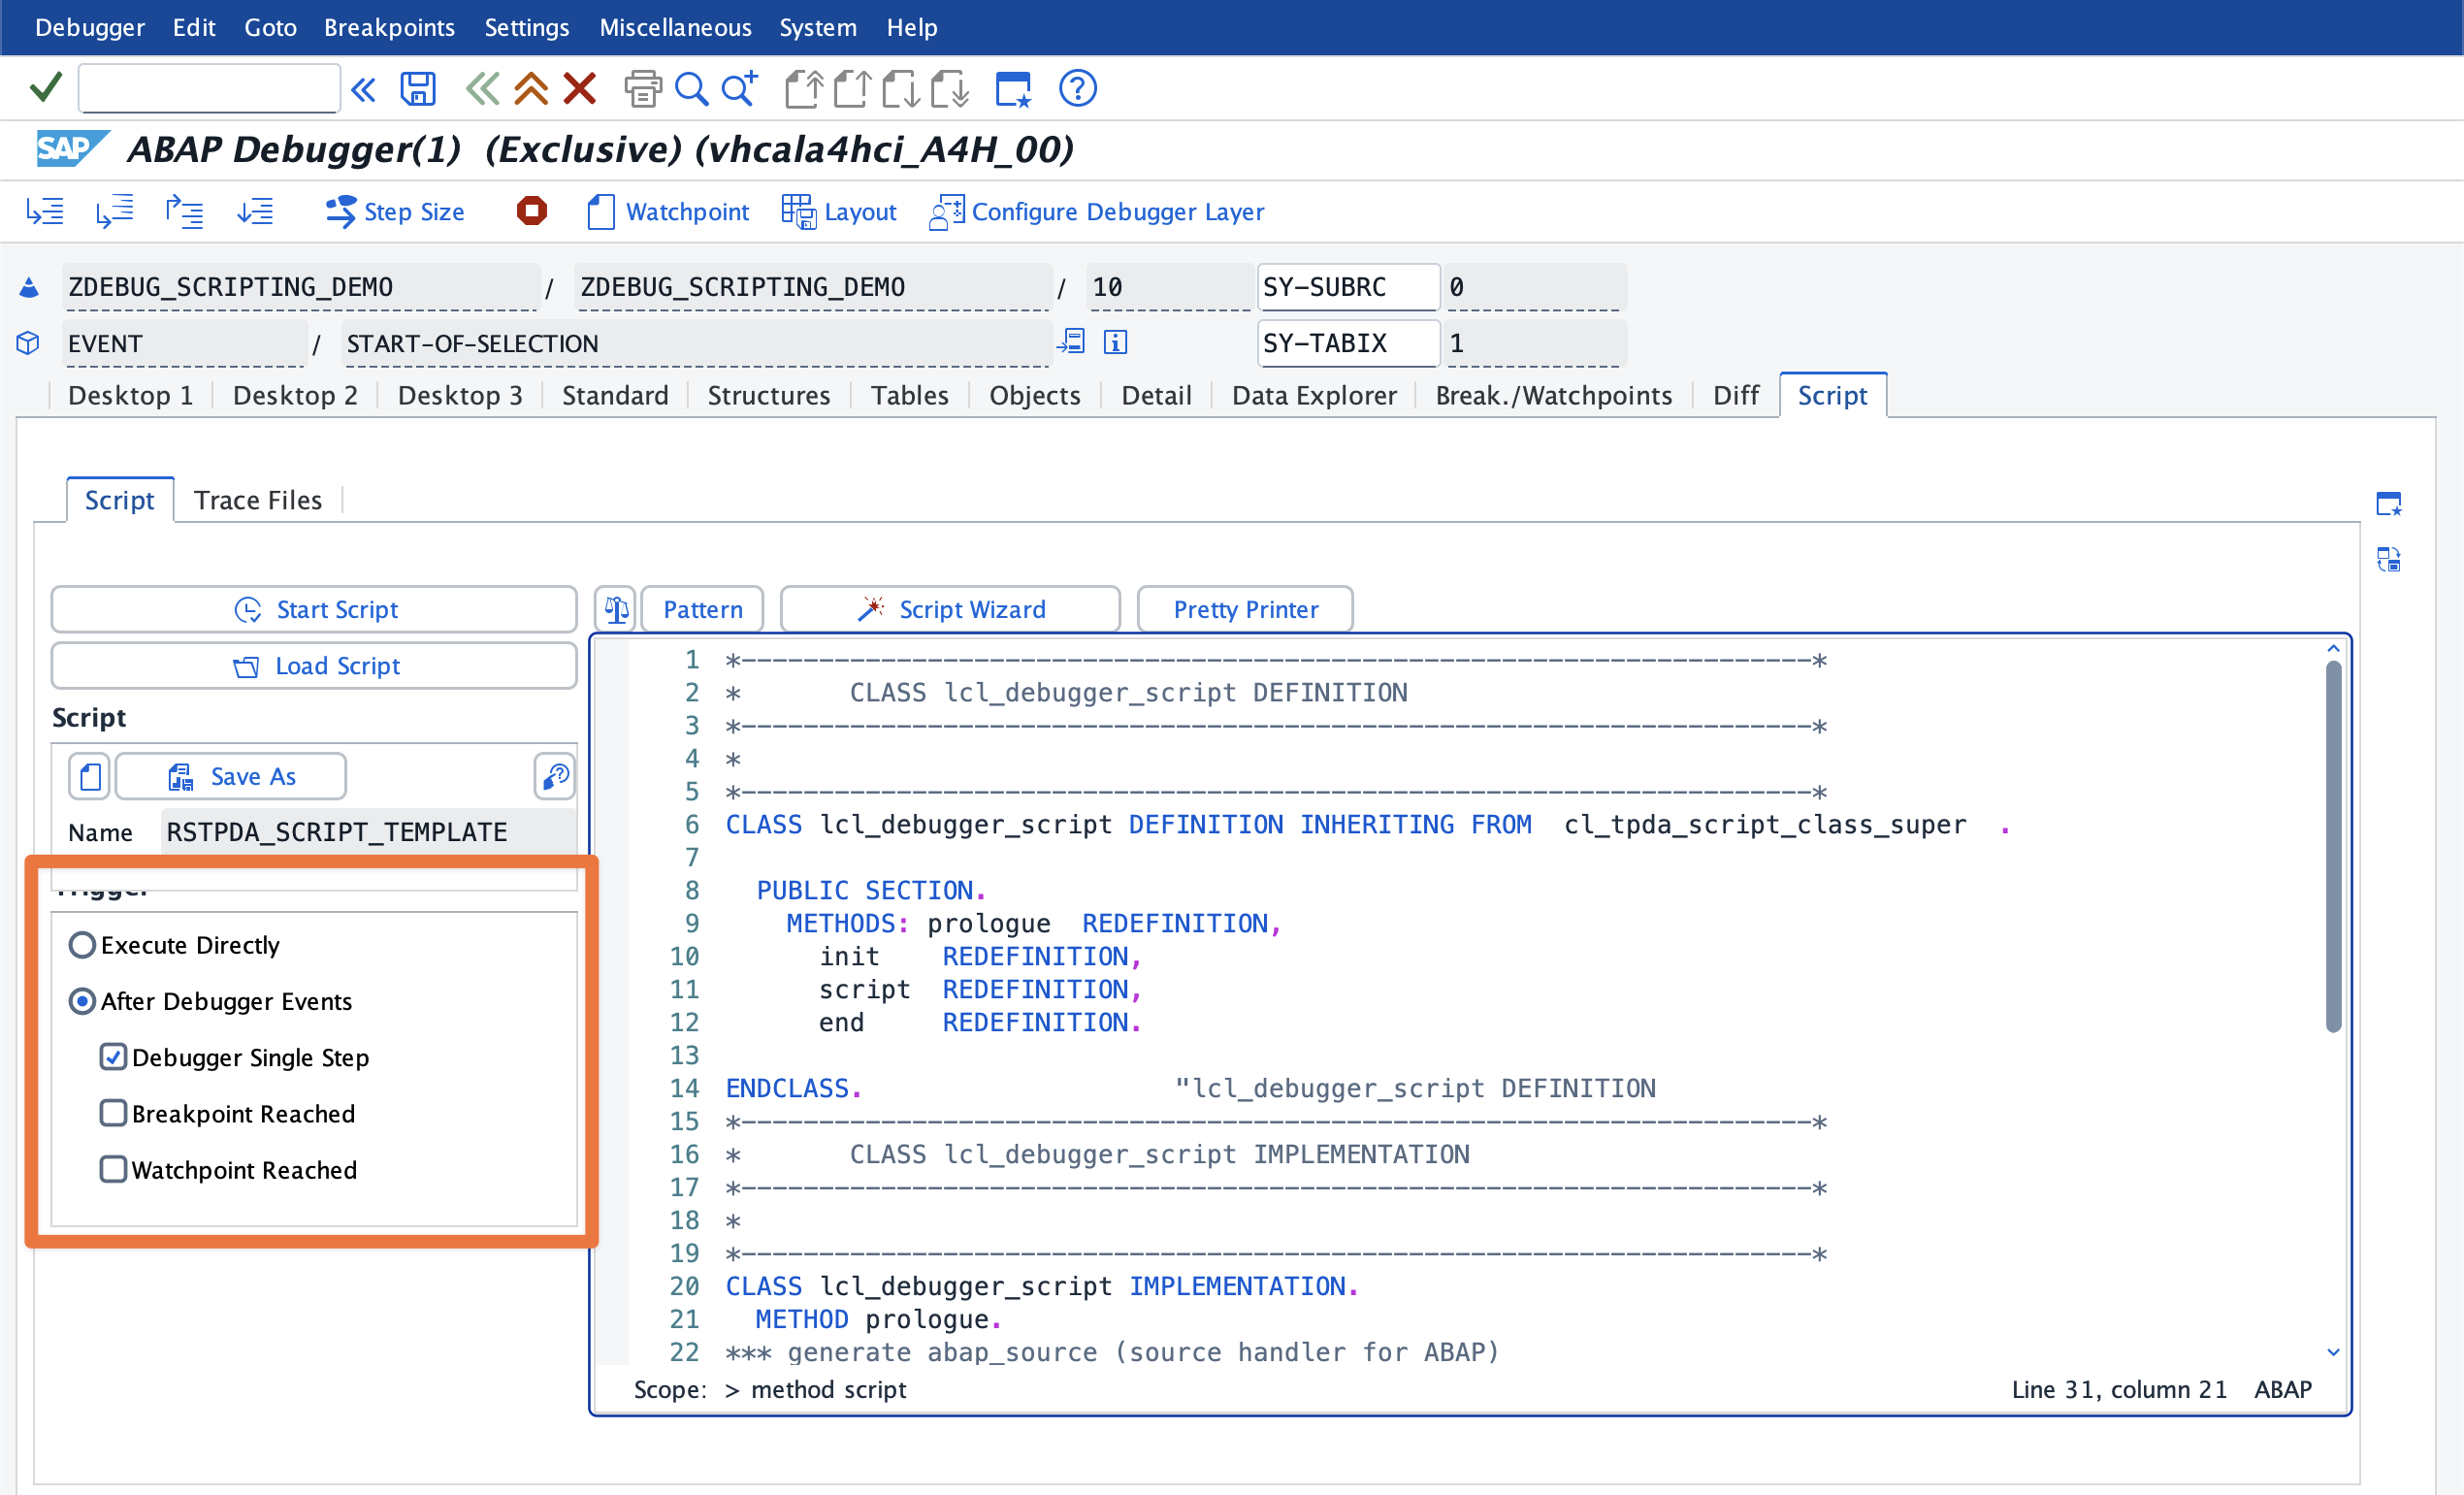
There are two modes:
Execute Directly means the script runs exactly once when you press "Start Script." The debugger does not call it again automatically. Use this for one-shot tasks like dumping data from a complex structure.
After Debugger Events ties the script to recurring debugger activity. You get three checkboxes:
- Debugger Single Step: the script runs after every single execution step, as if you were pressing F5 continuously. This is the setting for full statement traces. It can produce enormous output and slow things down noticeably on long-running code.
- Breakpoint Reached: the script runs each time a breakpoint is hit. These are separate breakpoints defined within the script context, not the ones you set in the source code editor for interactive debugging. When you check this option, a button appears that lets you define which breakpoints trigger the script.
- Watchpoint Reached: same concept, but for watchpoints. Also defined separately from your manual debugging watchpoints.
The separation between script-triggered breakpoints and your regular interactive breakpoints is deliberate. It lets you keep your own debugging breakpoints untouched while the script does its thing on a different set.
When you select "After Debugger Events" and press "Start Script," the debugger continues execution (like pressing F8) and calls your SCRIPT method each time the selected event occurs. It keeps running until your program hits a regular source code breakpoint, at which point the debugger pauses and gives you two options: "Stop Script" or "Continue Script." Stopping lets you inspect the trace collected so far. Continuing resumes execution until the next breakpoint.
This means you need at least two breakpoints in your source code: one where you start the script, and one where you stop it. If the script runs past your last breakpoint without another one ahead, the debugger has no way to give you back control and will appear to hang. There is no timeout. Set your stop breakpoint before you start the script.
A practical example: bypassing authority checks
You are debugging a transaction and keep getting stopped by AUTHORITY-CHECK statements. One check is easy enough to handle by hand: step over the statement, set SY-SUBRC to 0, continue. When there are ten of them scattered across the call stack, this stops being fun.
A debugger script handles it in a few lines:
METHOD script.

  debugger_controller->debug_step(
    p_command = cl_tpda_script_debugger_ctrl=>debug_step_over ).

  cl_tpda_script_data_descr=>change_value(
    p_new_value = '0'
    p_varname   = 'SY-SUBRC' ).

ENDMETHOD.
Set the trigger to "Breakpoint Reached," define a script breakpoint on the AUTHORITY-CHECK statement, paste the code above into the SCRIPT method, and press "Start Script." Every time the debugger hits an authority check, it steps over, resets SY-SUBRC, and continues. All checks pass without you touching anything.
Note that SAP still logs the actual authority check results in the System Log. The script changes SY-SUBRC after the fact, it does not suppress the check itself.
Full statement tracing with RSTPDA_SCRIPT_STATEMENT_TRACE
SAP ships a set of pre-built scripts. The most useful one for problem analysis is RSTPDA_SCRIPT_STATEMENT_TRACE, which logs every single executed ABAP statement to a trace. SAT (the ABAP Runtime Analysis) comes close but cannot capture every single executed statement. This script can.
To use it:
- Set two breakpoints in your source code: one where you want the trace to start, and one where you want it to stop. The second breakpoint is not optional. Without it, the debugger will run the script to the end of the program and hang with no way to regain control.
- Run your application until the debugger opens at your first breakpoint.
- Switch to the Script tab (last tab on the right).
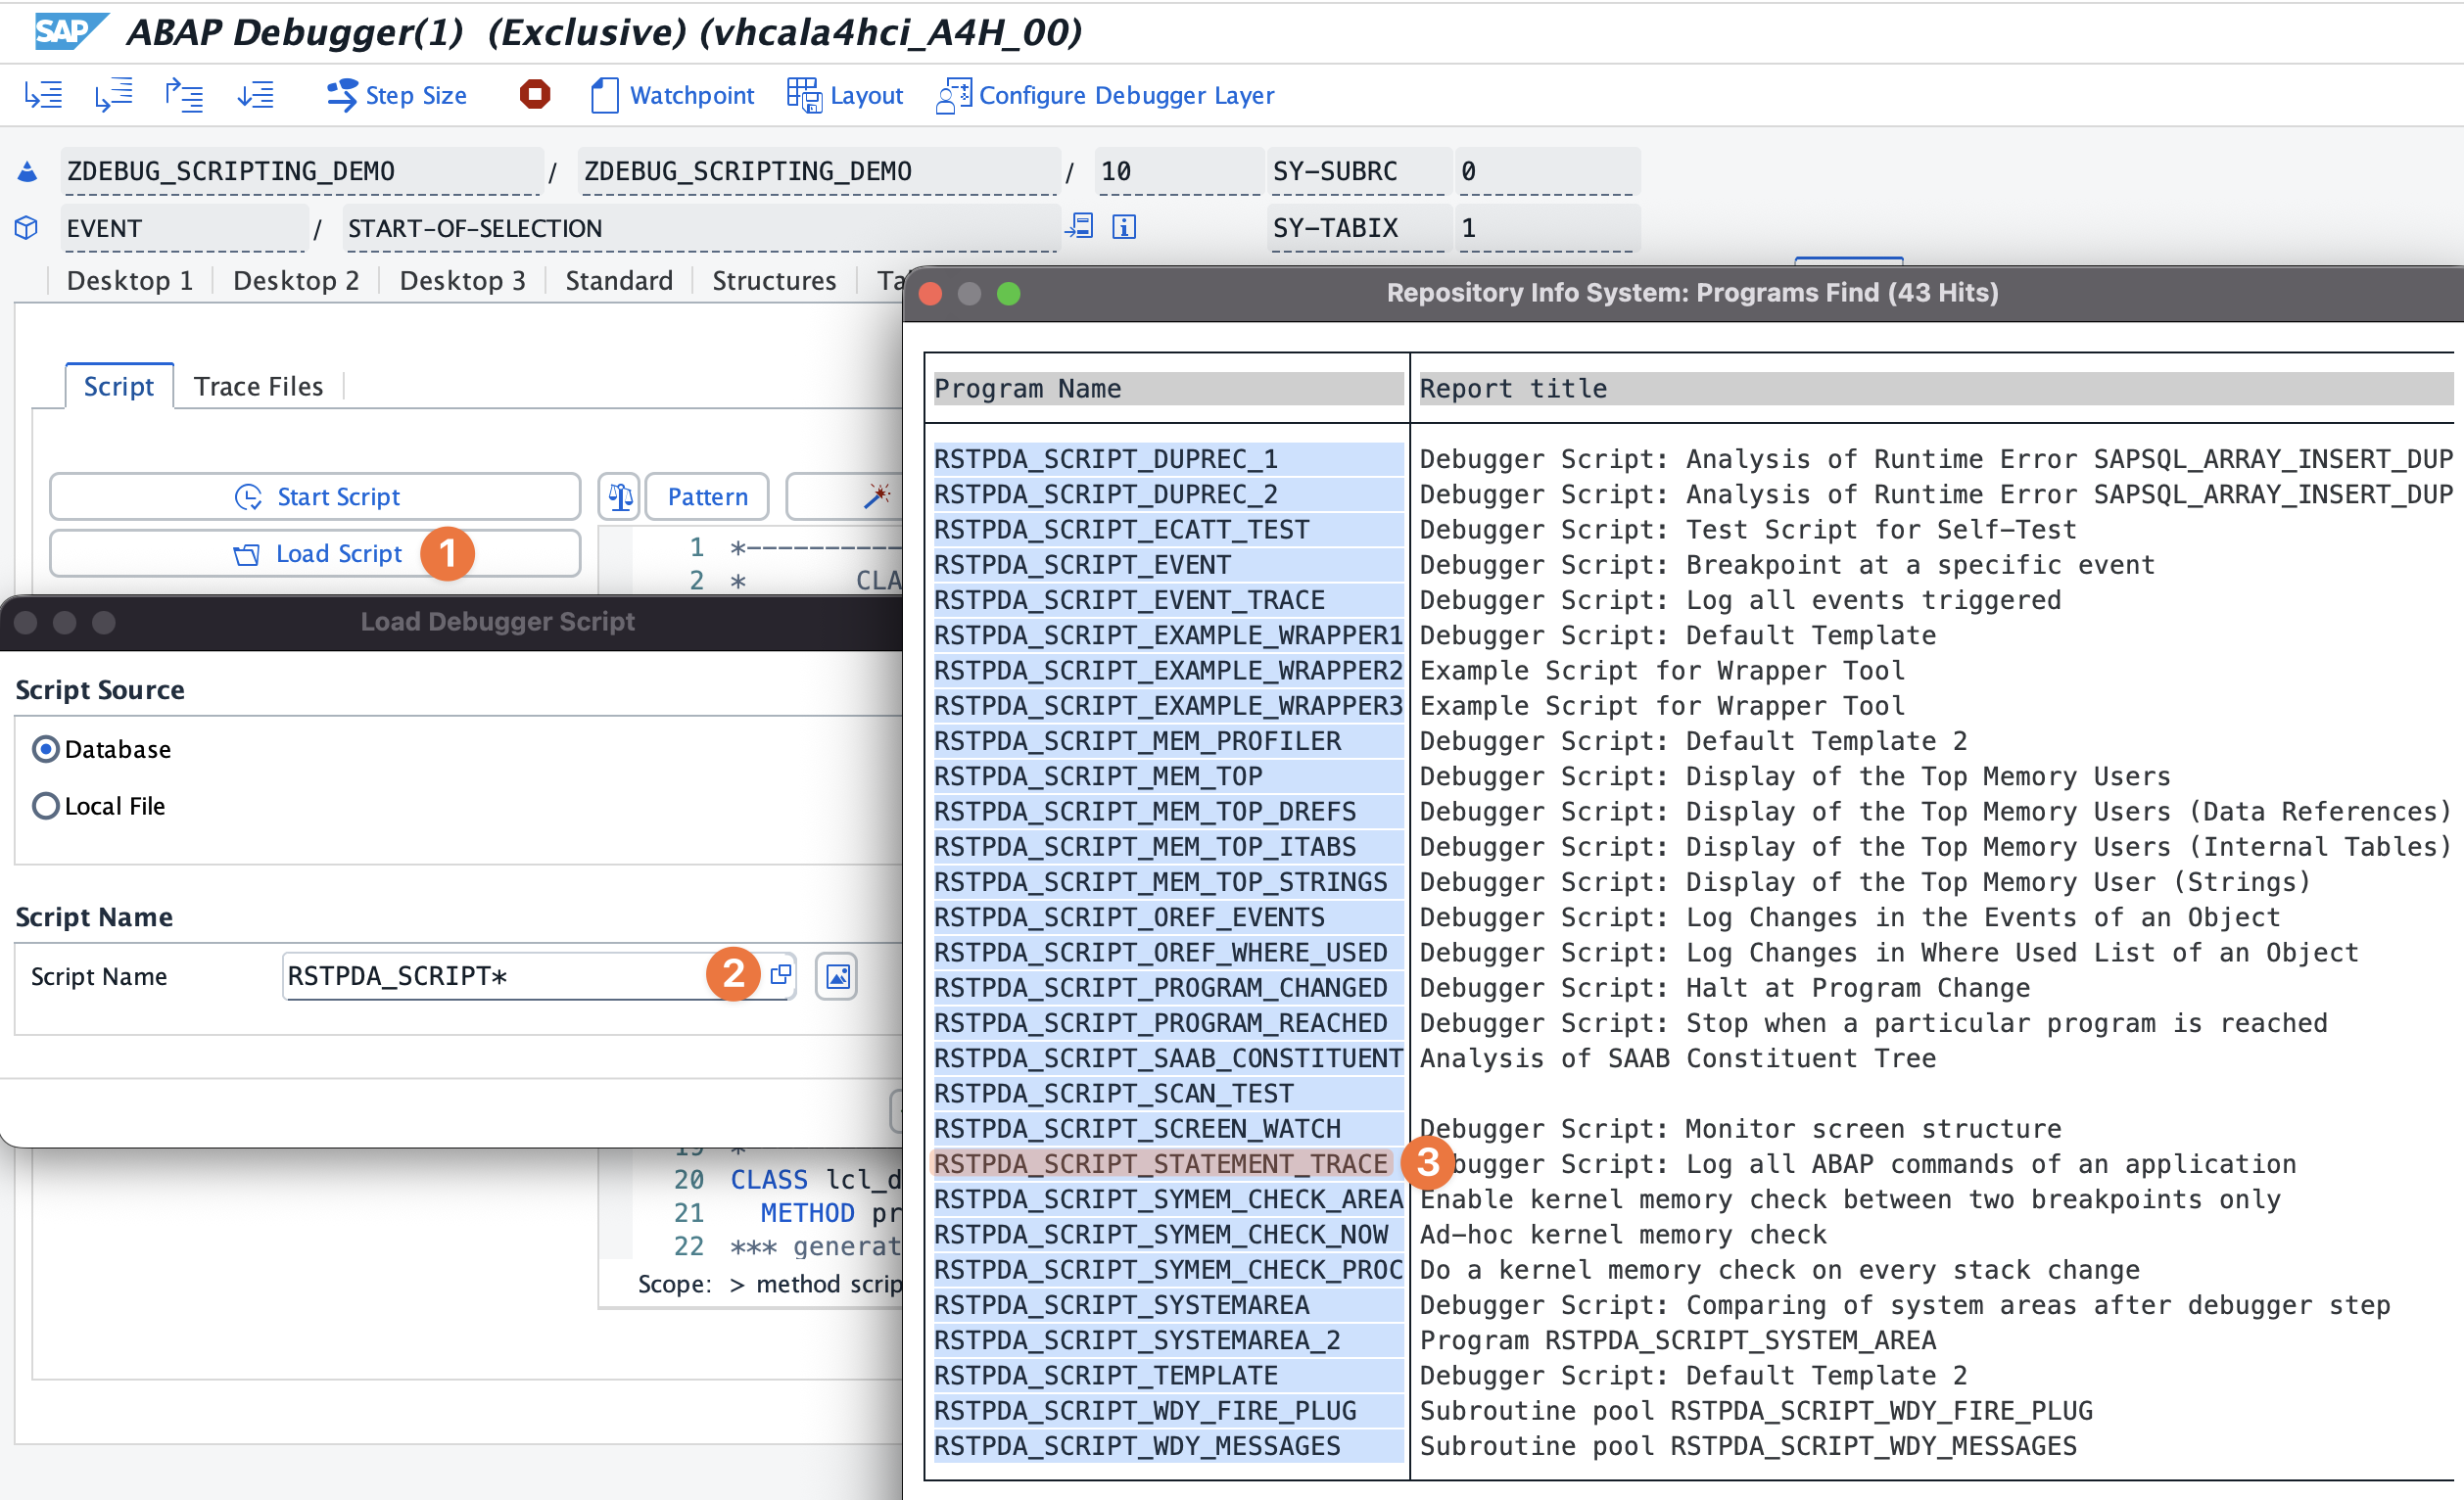
- Click "Load Script" (1), then use the F4 value help (2) to browse available scripts. Select
RSTPDA_SCRIPT_STATEMENT_TRACEfrom the list (3).
- The script loads into the editor and sets the trigger to "Debugger Single Step" automatically.
- Click "Start Script."
The debugger continues execution, tracing every statement along the way. When it hits your second breakpoint, it pauses and presents two buttons: "Exit Script" and "Continue Script."
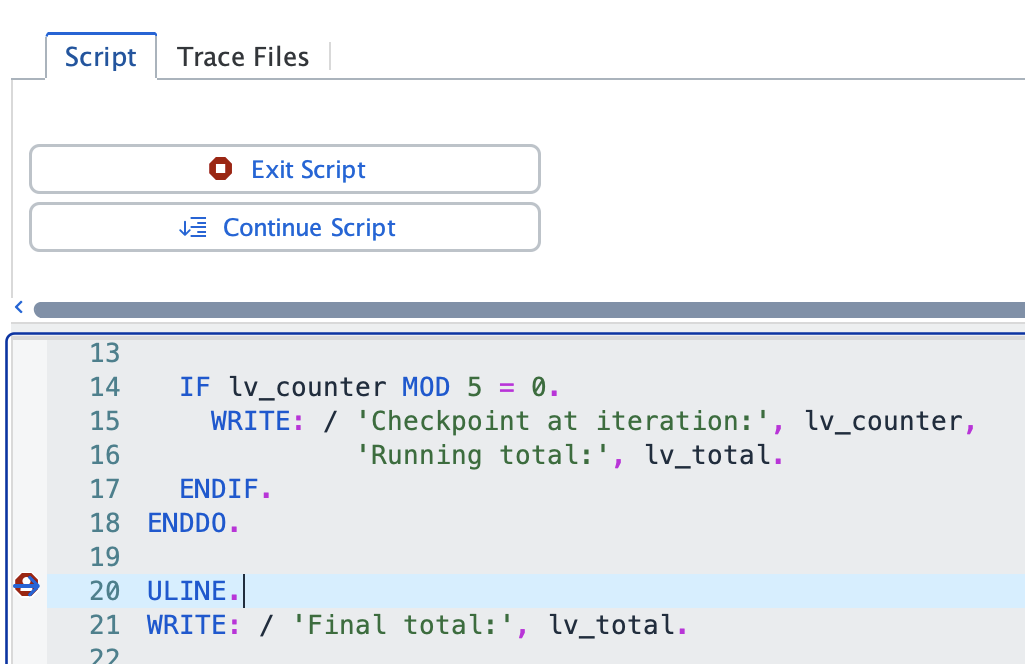
"Continue Script" resumes execution until the next breakpoint. "Exit Script" stops the script and returns you to the Script tab, where you can inspect the trace. Do not press "Continue Script" if there is no further breakpoint ahead. The debugger will hang with no way to recover.
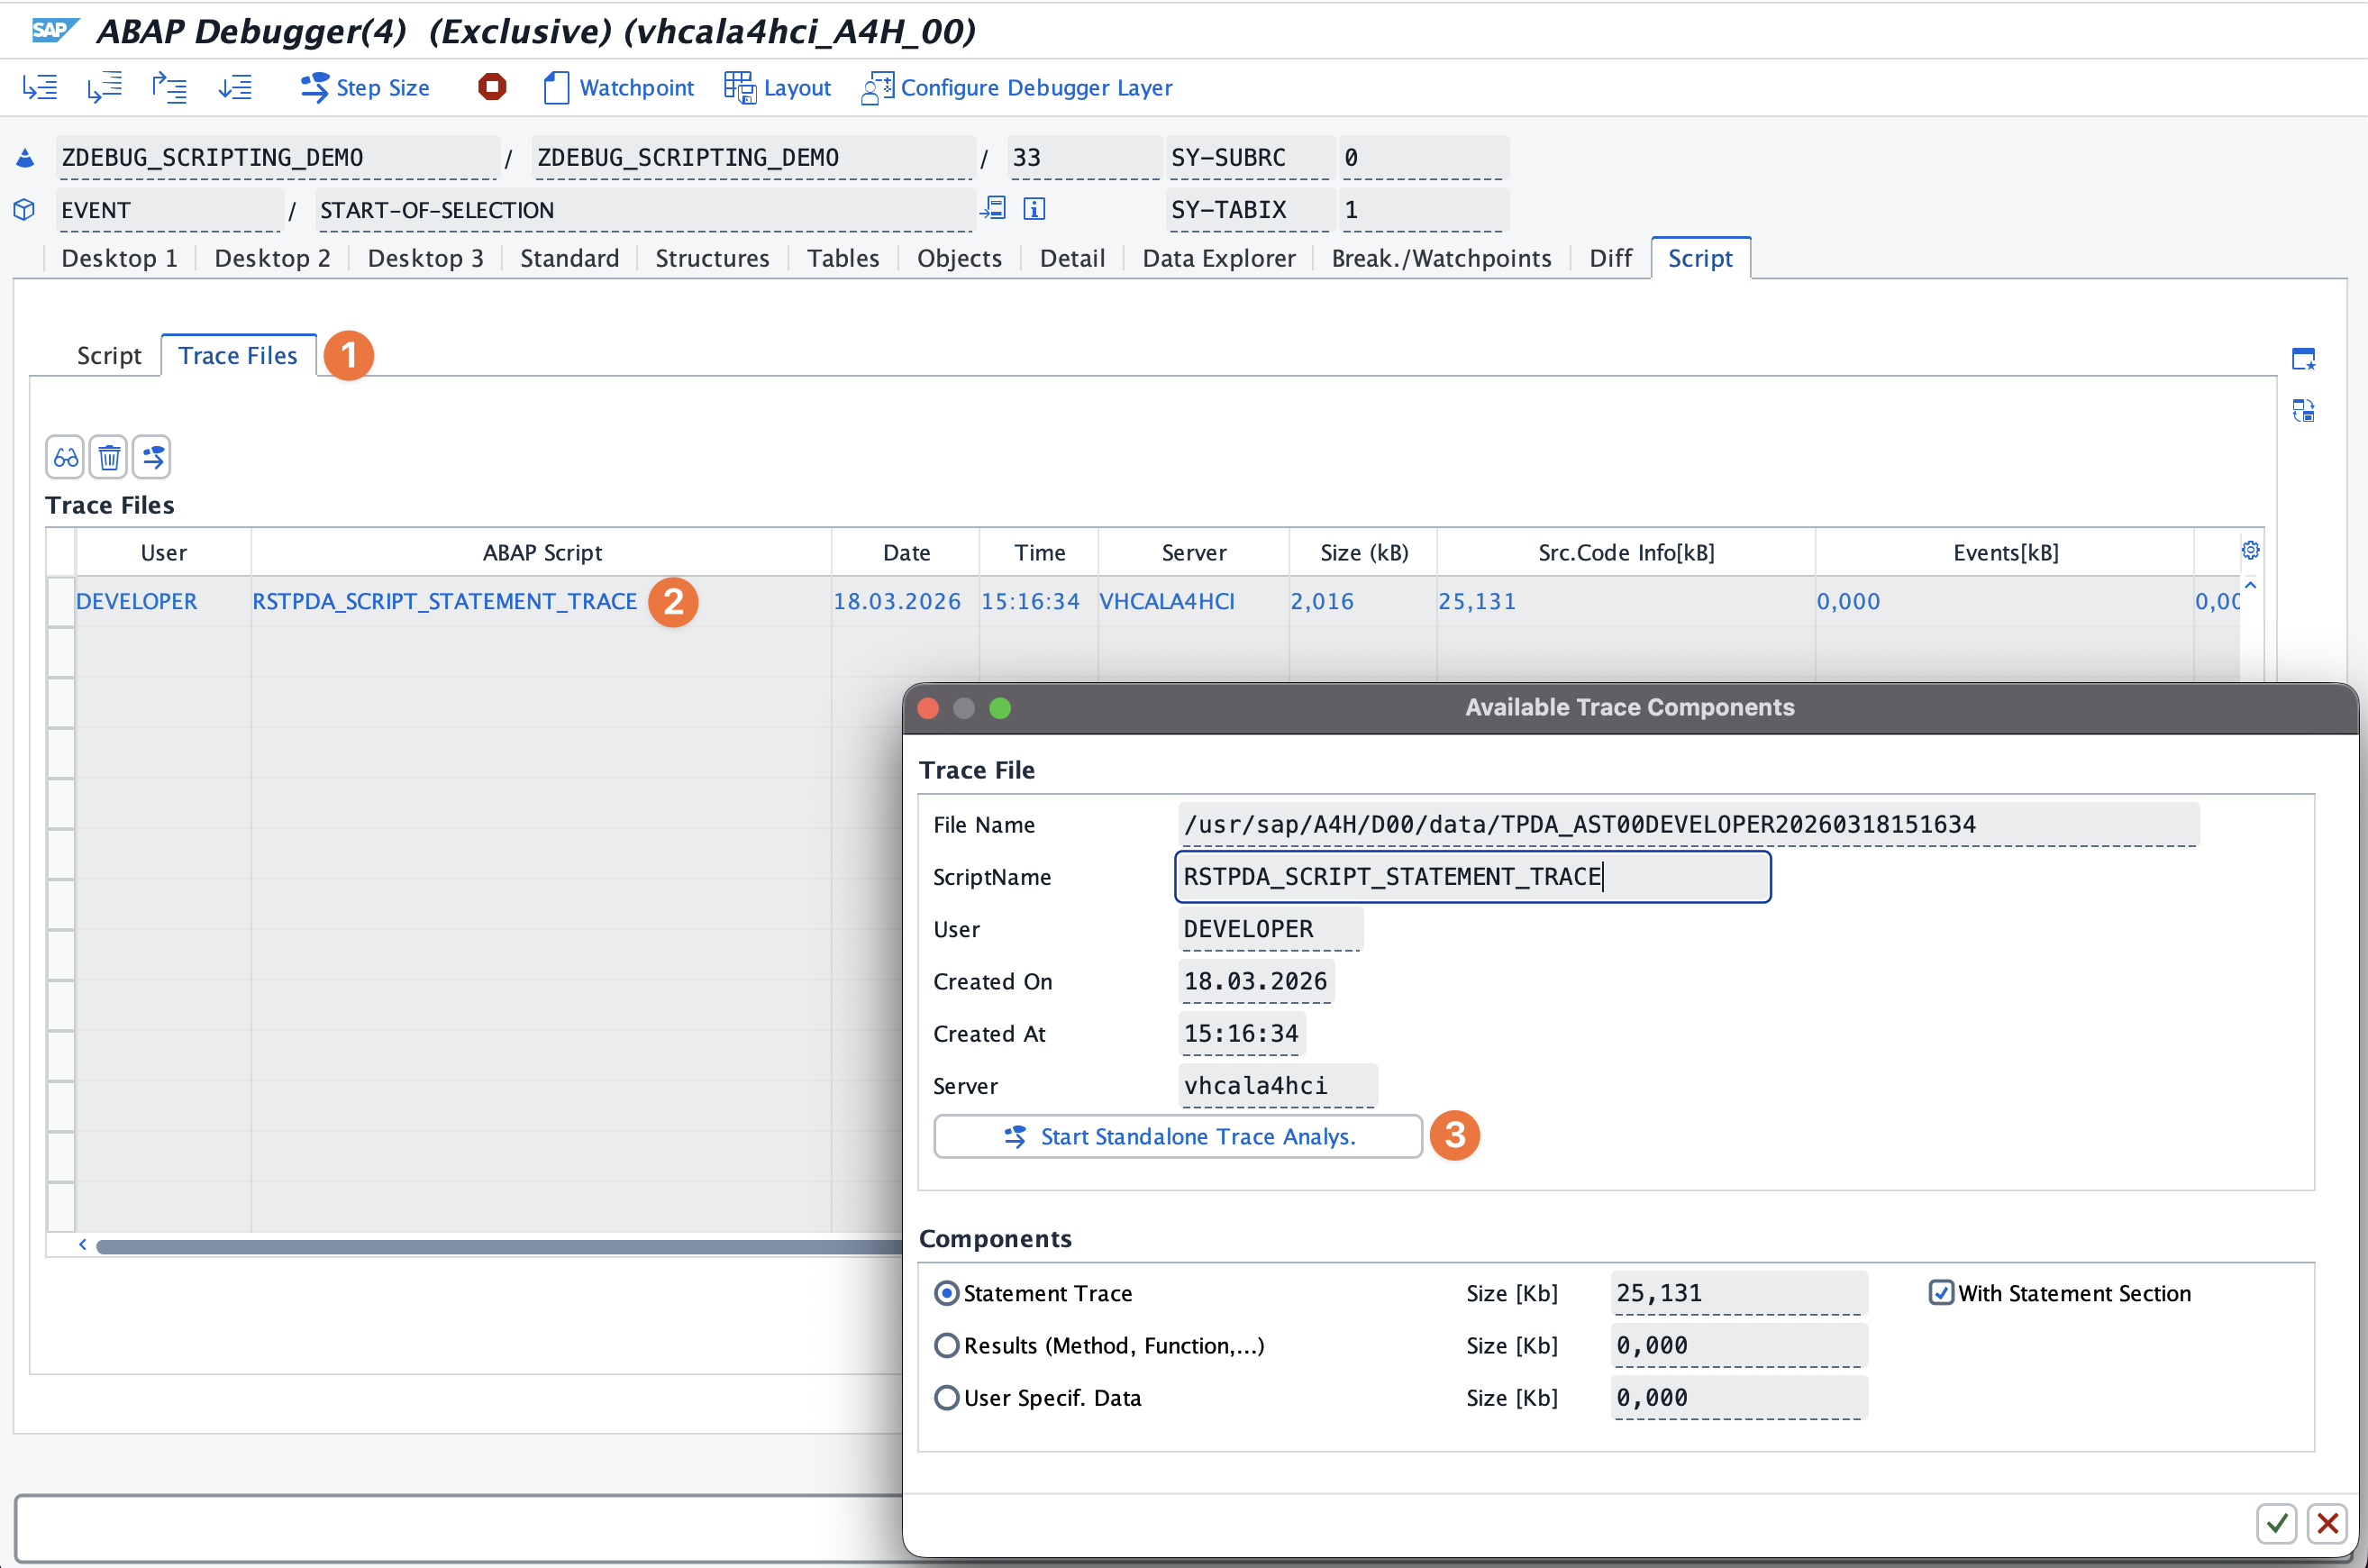
Once you have exited the script, switch to the "Trace Files" tab (1) in the Script panel. Double-click the trace entry (2) to open the trace details, then click "Start Standalone Trace Analysis" (3) to open it in transaction SAS.
In SAS, click "Statements" (4) under Trace Selection to display the full list of traced statements with their program, include, line number, and source code.
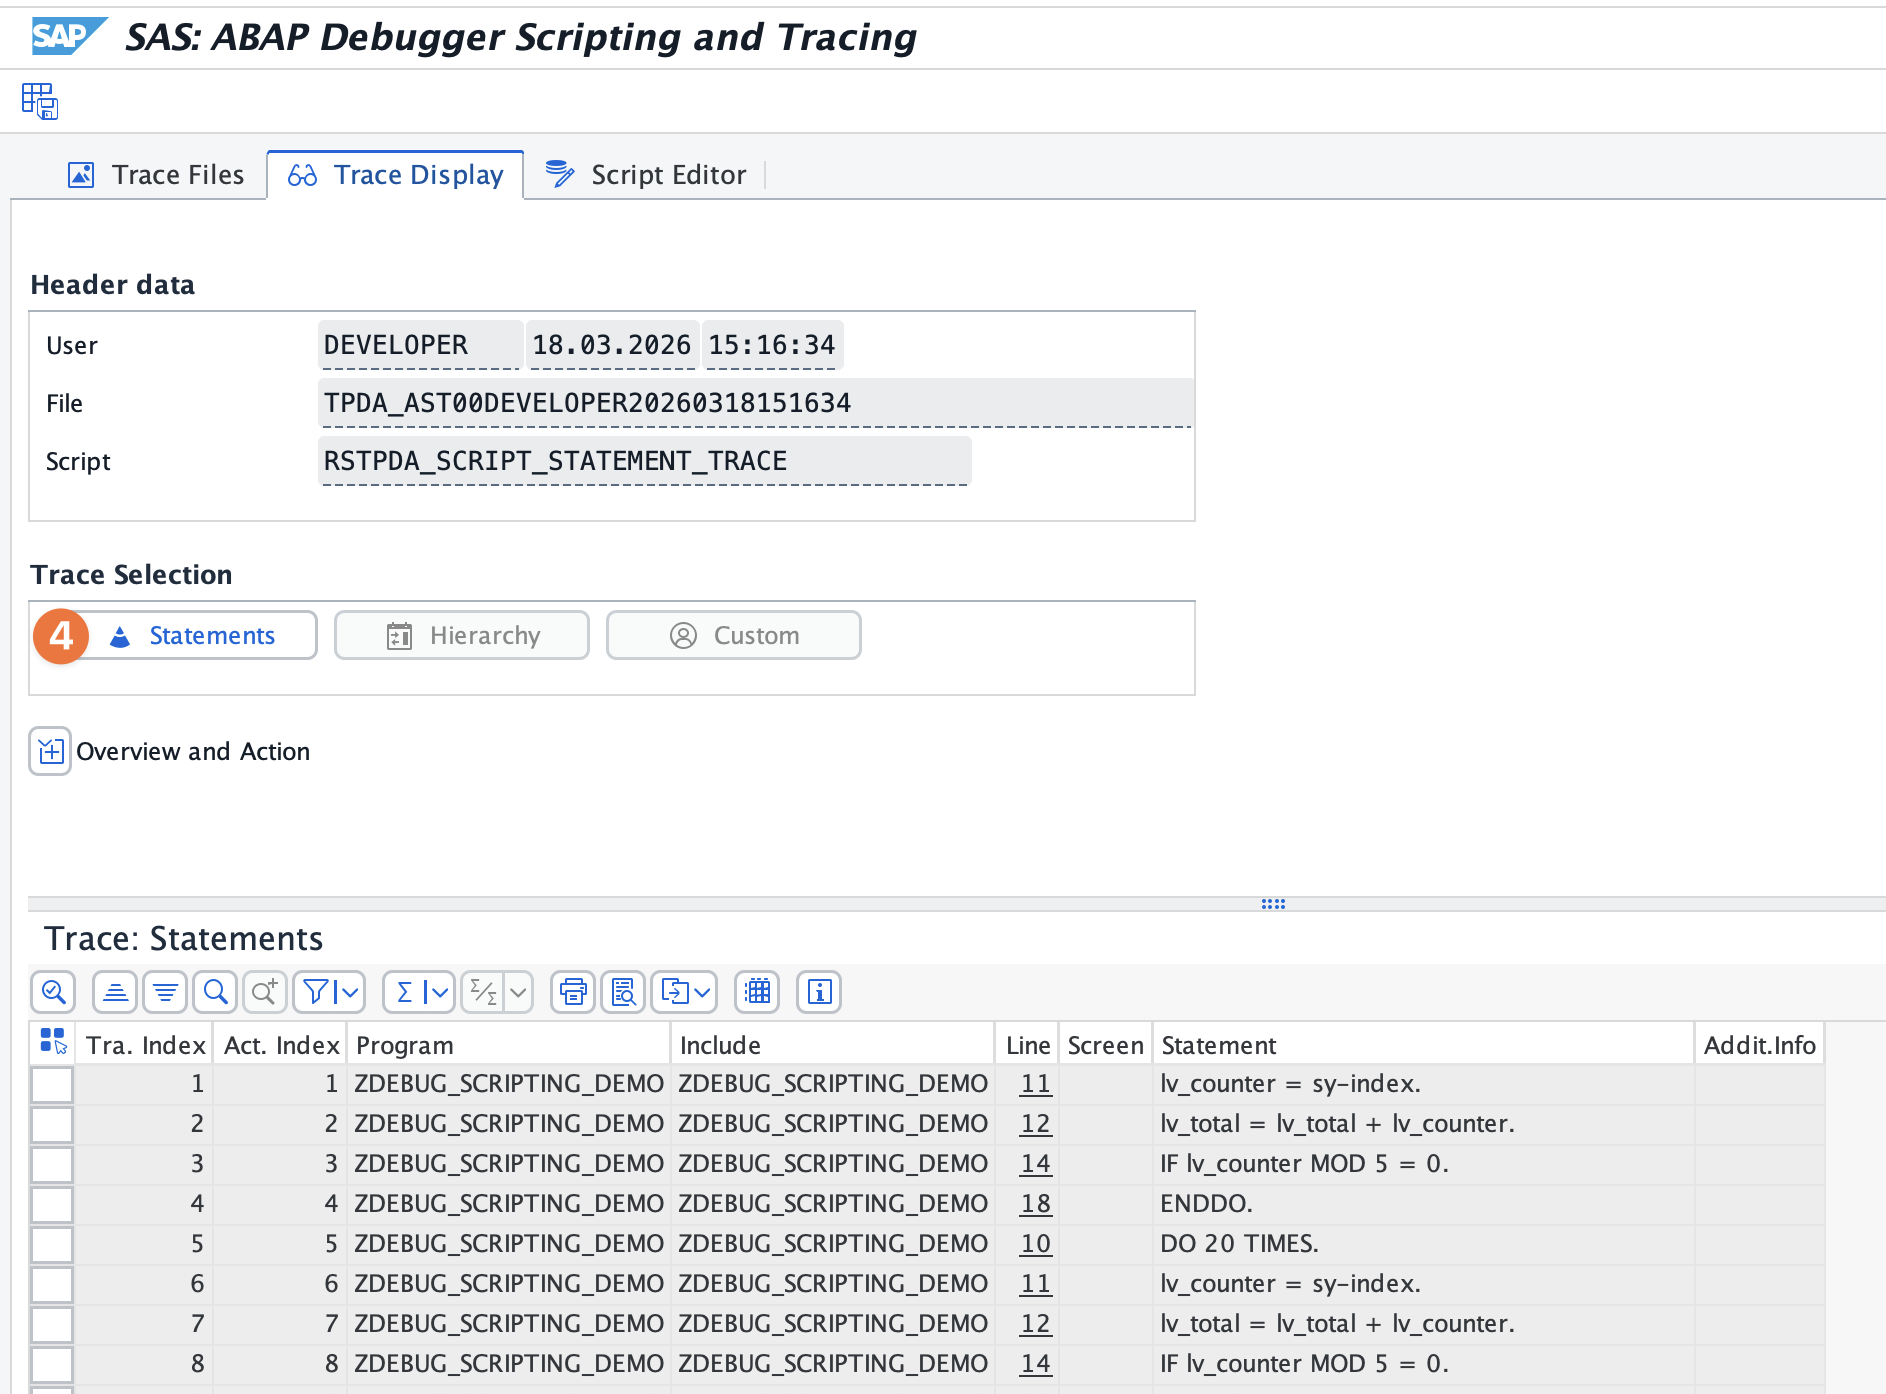
The trace output can get large. Hundreds of thousands of lines for a non-trivial piece of code. You can export it to a local file and compare traces from different runs using any diff tool. This is how you find the exact point where two supposedly identical code paths diverge.
Transaction SAS
You can also work with scripts outside the debugger entirely. Transaction SAS ("ABAP Debugger Scripting and Tracing") gives you the same script editor and trace viewer without tying up a dialog work process. You cannot execute scripts from SAS (that requires an active debugger session), but you can write, edit, and save them at your own pace. You can also browse and export traces created by previous script runs.
Controlling execution
The DEBUGGER_CONTROLLER supports the same stepping commands you use manually:
" Step into (F5)
debugger_controller->debug_step(
  p_command = cl_tpda_script_debugger_ctrl=>debug_step_into ).

" Step over (F6)
debugger_controller->debug_step(
  p_command = cl_tpda_script_debugger_ctrl=>debug_step_over ).

" Step out (F7)
debugger_controller->debug_step(
  p_command = cl_tpda_script_debugger_ctrl=>debug_step_out ).

" Continue (F8)
debugger_controller->debug_step(
  p_command = cl_tpda_script_debugger_ctrl=>debug_continue ).
Combine these with CL_TPDA_SCRIPT_DATA_DESCR to read and modify variables at each stop. That gives you programmatic control over the full debug session.
Reading and modifying variables
Reading a simple variable:
DATA lv_value TYPE string.

cl_tpda_script_data_descr=>get_simple_value(
  EXPORTING
    p_varname = 'LV_COUNTER'
  IMPORTING
    p_value   = lv_value ).
Changing one:
cl_tpda_script_data_descr=>change_value(
  p_new_value = '42'
  p_varname   = 'LV_COUNTER' ).
For structures and internal tables, the API provides additional methods on CL_TPDA_SCRIPT_DATA_DESCR to navigate complex data objects.
Writing to the trace
The TRACE object lets you log information during execution:
trace->add_src_info( ).
This writes the current source position to the trace. For custom entries:
DATA ls_trace_entry TYPE tpda_trace_custom.
ls_trace_entry-value = 'Counter value: ' && lv_value.
trace->add_custom_info( p_trace_entry = ls_trace_entry ).
After the script finishes, the trace gives you a full log across all iterations. When you need to understand how a variable evolves over 500 loop iterations, this beats watching each one by hand.
The Script Wizard
If the API is unfamiliar, the Script Wizard button in the Script tab generates code snippets for common operations. It groups available services into categories (debugger control, variable access, breakpoint management, trace writing, source code access) and inserts the corresponding method calls with parameter signatures and relevant constants as comments. Position your cursor, pick a service, and the boilerplate appears. It is a reasonable way to learn the API before the class interfaces become familiar.
Saving and sharing scripts
Scripts are regular ABAP programs (subroutine pools). You can save them to the ABAP repository or download them to a local file for sharing across systems. SAP's own pre-built scripts follow the naming convention RSTPDA_SCRIPT_*. Sticking to a consistent naming scheme for your own scripts makes them easier to find later through the "Load Script" dialog.
Where this fits
Debugger scripting is not something you reach for every day. But when the alternative is clicking through the debugger manually for twenty minutes, or writing a throwaway test report to reproduce a specific scenario, a script is the faster path. It runs inside the actual debug session, operates on real data, and can be saved for the next time the same kind of problem shows up.
The feature has been around since 2010, shipped with NetWeaver 7.0 EHP2. It deserves more clicks than it gets.